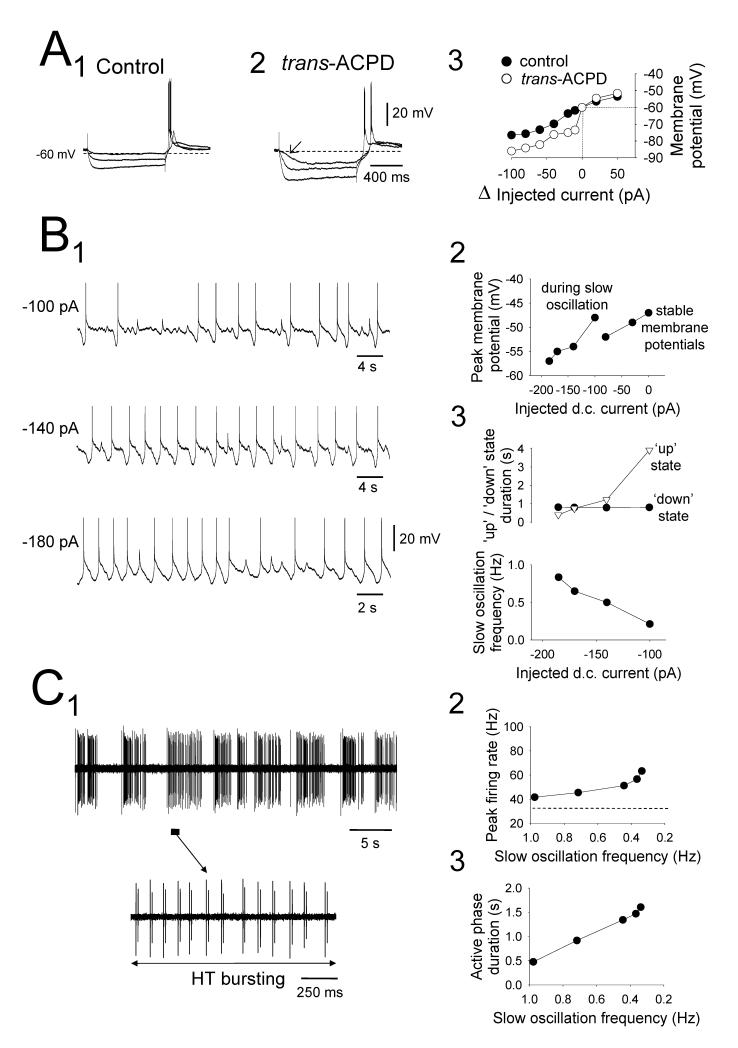
Figure 9. Intra- and extracellular recordings of the slow oscillation in the rat LGN.
A1 and A2. Voltage response of a rat LGN TC neuron to a range of injected current steps before (1) and after (2) trans-ACPD application. Note the appearance of a distinctly non-linear membrane charging pattern in A2 which encompasses an inflection point ( ). Trans-ACPD also led to a slow oscillation in this neuron (shown in Supp. Fig. 4A). A3. Relationship between changes in injected d.c. current and membrane potential for the neuron depicted in A1 and A2. B1. Changes in the activity of a different rat LGN TC neuron exhibiting a ‘quiescent’ slow oscillation in response to variations in injected d.c. current. B2. Plot showing the peak membrane potentials evident at different levels of injected current. Note that the UP state can generate a level of depolarization which is greater than a range of stable membrane potentials reached when the neuron is subject to more injected current. B3. Plots showing the variation in UP (
 ) and DOWN (•) state duration (top) and slow oscillation frequency (bottom) with respect to injected d.c. current. Note that the change in frequency occurs almost exclusively through a variation in the UP state duration. C1. ‘Active’ slow oscillation the rat LGN comprising additional firing which is predominantly composed of HT bursting (see expanded section below). C2. Plot showing the peak rates of firing at different frequencies of the slow oscillation shown in C1. The dotted line represents the mean rate of continuous firing in the presence of 100 μM trans-ACPD (see Supplementary Information for further details). C3. Plot illustrating the alteration in the duration of the active phase that occurs as the frequency of the slow oscillation changes.

