
Fig. 1.
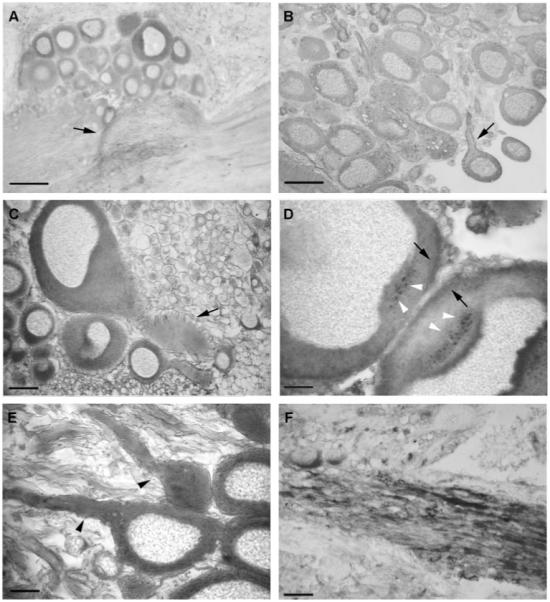
A–F: F3/contactin-related immunoreactivity on sections from Helix pomatia cerebral ganglia. Low-power pictures (A,B) demonstrated variable but relevant expression on both cell bodies and fiber tracts. Expression was observed on neurites (arrows in A,B) with both axoplasmatic and membrane (arrow in B) staining. High-power pictures (C–E) confirmed strong expression within the cytoplasm, in particular on intracellular organelles (D, white arrowheads), whereas low or absent antigen location was found within the nuclei (C–E). Antigen expression was also associated with fibers, on which a nonhomogeneous distribution was observed (A,E,F). In E, arrowheads point to low- and high-antigen-expressing axons. No expression was observed within the trophospongium (arrow in C). Scale bars = 100 μm in A,B; 20 μm in C,F; 10 μm in D,E.