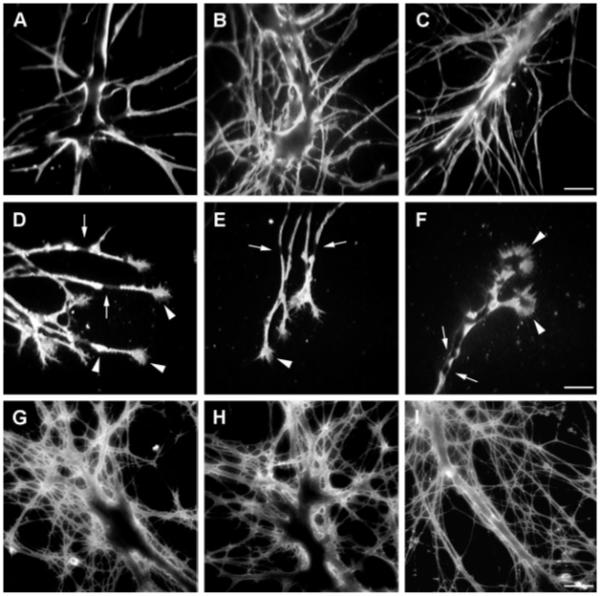
Fig. 4.

HCRP-related immunoreactivity on cultured neurons from the cerebral ganglia. A–F: On fixed cells, F3/contactin antibodies stained both the main axonal stump (A–C) and the arising branching neurites. A membrane-like profile and a patchy distribution of the immunostaining were observed, indicating clustering of the corresponding surface molecules; however, some distinct regions appeared immunonegative along the labelled axons (arrows). Strong expression was also found on the growth cones and varicosities along the neurites (white arrowheads in D–F). G–I: HCRPs-related immunoreactivity on living cultures from the cerebral ganglia. Scale bars = 50 μm in C (applies to A–C); 50 μm in F (applies to D–F); 50 μm in I (applies to G–I).
