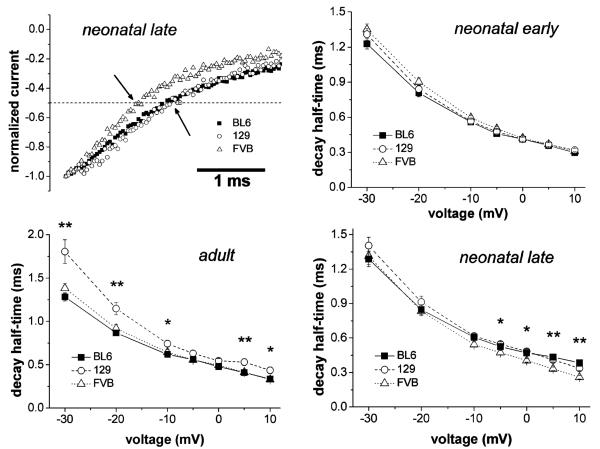
Fig. 1.
Comparison of the current decay kinetics in skeletal myocytes derived from different mouse strains. Typical examples of current decay at Imax are displayed in the top left image. The arrows indicate the time points at which current decay half-times were measured. These represent the time periods between the current peak and the time point at which the current had decayed to 50%. In the graphs, current decay half-times were plotted against the membrane voltage (steps between −30 and +10 mV from a holding potential of −120 mV) for myocytes derived from neonatal (early and late differentiation window) and adult mice. The lines connect single data points. Data are expressed as means±SE. *p<0.05 and **p<0.01 indicate a significant difference between the three strains at certain potentials revealed by ANOVA

