
Figure 4.
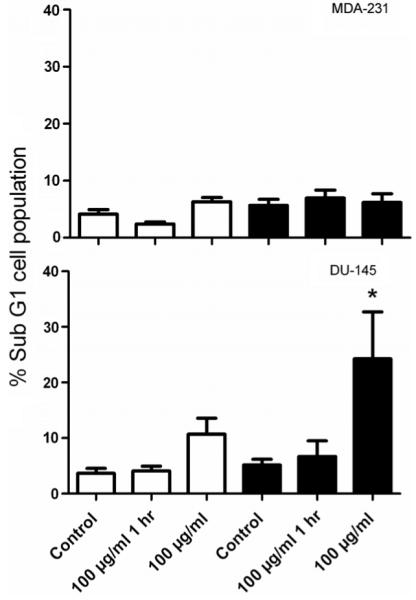
Measurement of apoptosis by flow cytometry. MDA-231-MB and DU-145 cells were exposed to nanoparticles at a concentration 100 μg ml−1 for 1 and 24 h. Samples were labelled with propidium iodide (PI) at 24 (open bars) and 48 h (closed bars) and analysed by flow cytometry. Changes in the sub G1 cell populations are shown relative to untreated control cells. Data points show the mean from three independent measurements ± SEM.