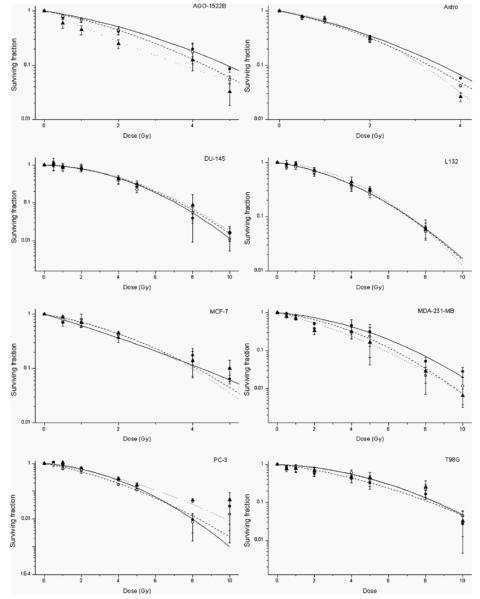
Figure 7.
Measurement of radiation dose modifying response. Radiation dose response curves were determined by colony forming assay for cells irradiated with 10 and 100 μg ml−1 nanoparticles. Cells were incubated with nanoparticles 1 h prior to irradiation with 160 kVp x-rays. Each of the radiation dose response curves for each of the cell lines are shown as x-ray control (○ solid line); 10 μg ml−1 gold nanoparticles (● dotted line) and 100 μg ml−1 gold nanoparticles (▲ dashed line). Surviving fractions were normalized to non irradiated control cells in each of the experimental groups. Data points show the mean of at least three independent experiments ± SEM.

