
Figure 3.
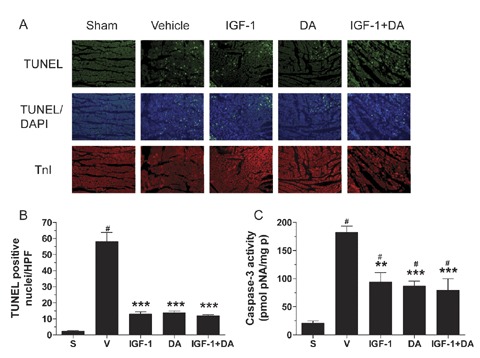
Post‐I/R apoptosis. (A) Representative photographs of TUNEL‐stained tissue sections from the different treatment groups. TUNEL (green), apoptotic nuclei, DAPI (blue), total nuclei, and TnI (red), myocytes. (B) TUNEL‐positive nuclei quantification represented as number per high‐power field (HPF). (C) Caspase‐3 activity represented as pmol of substrate (pNA) per mg of protein (mg p). (n= 5–15/group; **p < 0.01 or ***p < 0.001 vs. vehicle, # p < 0.05 vs. sham; S, Sham, V, vehicle.)