
Figure 6.
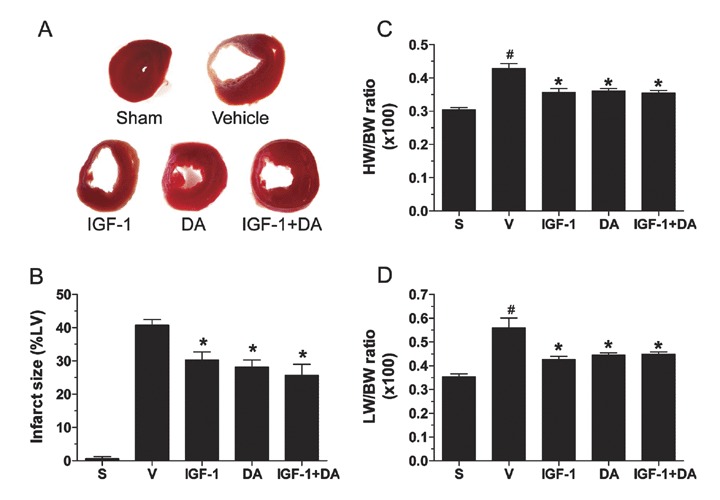
Postischemia infarction size. (A) Representative photographs of TTC‐stained rat heart sections from the different treatment groups. (B) LV infarct size expressed as percentage of the LV in each group. (C) Heart weight (HW)‐to‐body weight (BW) ratio. (D) Lung weight (LW)‐to‐body weight (BW) ratio. (n= 4–22/group; *p < 0.05 vs. vehicle, # p < 0.05 vs. sham; S, sham, V, vehicle.)