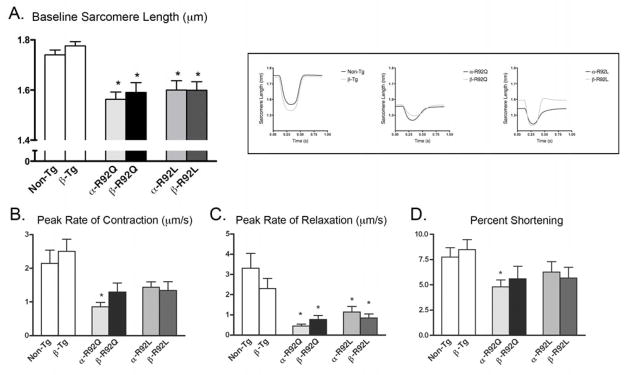
Figure 2. Cardiac ventricular myocyte contraction and relaxation patterns.
Representative contraction/relaxation tracings are shown in the inset. A. α-R92Q and α-R92L mutations resulted in shorter sarcomere lengths (μm) (1.56 for α-R92Q, 1.60 for α-R92L vs. 1.74 for Non-Tg, p<0.001); double transgenic sarcomere lengths remained statistically similar to their respective MyHC littermates. B. The peak rate of contraction (μm/s) was impaired in α-R92Q (0.86 for α-R92Q vs. 1.14 for Non-Tg) and rescued in β-R92Q: peak rate of contraction was normal in the R92L myocytes. C. The peak rate of relaxation in isolated α-R92Q and α-R92L myocytes was severely impaired and did not improve with increased β-MyHC expression. D. Percent sarcomeric shortening was impaired only for α-R92Q myocytes (4.8% for α-R92Q vs. 7.5% for Non-Tg, p<0.05); percent shortening for β-MyHC myocytes was not different from Non-Tg. An n of 4–6 animals were used for each group with at least 50 cells analyzed. Data are presented as means ± SEM. * p<0.05 vs Non-Tg.

