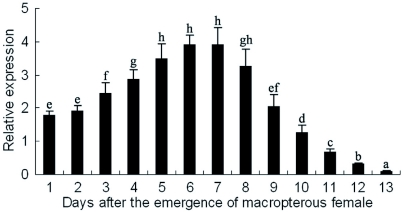
Figure 6.
The dynamics of the relative NlFAMeT transcript levels in Ab- samples from macropterous female adults. The data represent mean values ± SE of at least three repeats. Different lowercase letters above the columns indicate the significant differences at the p < 0.05 level. High quality figures are available online.

