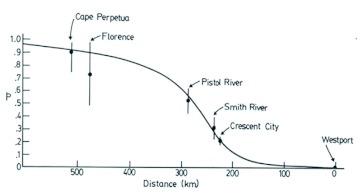
Figure 12.
Frequency (p) of the dominant red (R) allele (± 95% confidence limits with sample sizes given in Figure 11) in queens of Bombus melanopygus (Hymenoptera: Apidae) along the coast of Oregon and California. The fitted line is the theoretical cline calculated using equations 29 and 30 of Owen (1986). High quality figures are available online.

