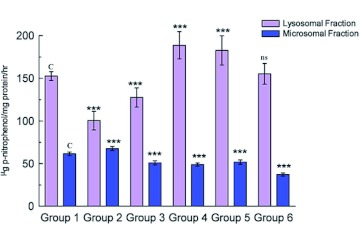
Figure 3.
Estimation of ACP activity in lysosomal and microsomal fractions in midgut tissue. Data are means ± SD (n = 6). *** shows highly significant change (p < 0.001), ** Shows significant change (p< 0.05), ns shows non-significant change over the control group. High quality figures are available online.

