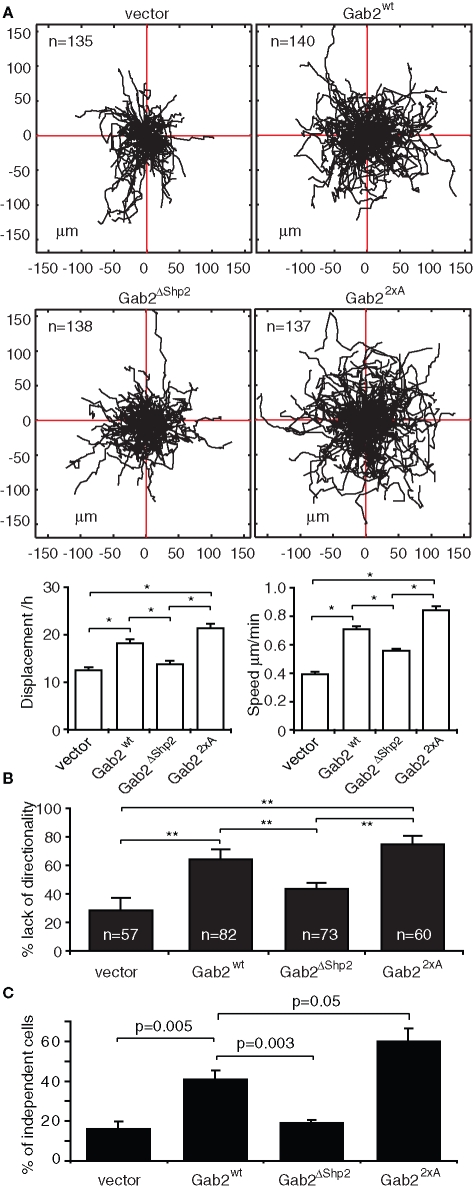
FIGURE 4:
Effects of Gab2 on cell motility and epithelial colony stability and formation. (A) Effect of Gab2 and Gab2 mutants on random cell motility. Tree graphs show length (μm), direction, and displacement (distance from origin) of more than 150 paths. Graphs indicate effects on cell displacement and speed. (B) Effect of Gab2 on directionality of migration. (C) Effect of Gab2 on cellular independence. Data points are mean ± SE; * and ** indicate p < 0.01 and p < 0.001, respectively.

