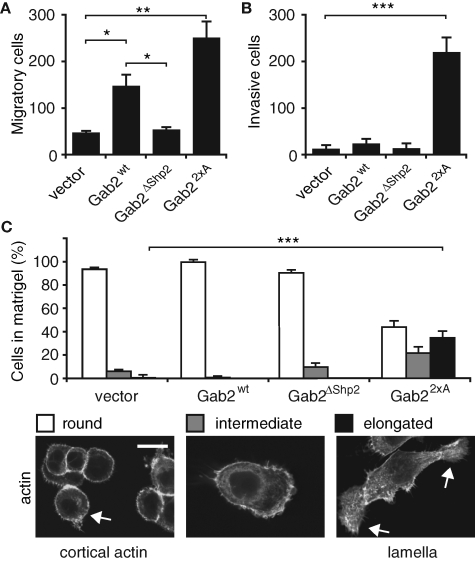
FIGURE 5:
Effects of Gab2 and Gab2 mutants on cell migration and invasion. (A) Results of transwell migration assays. (B) Results of transwell invasion assays. In (A) and (B), histograms represent mean number of cells/field ± SE. (C) Morphology of cells in Matrigel. Images show phalloidin staining of cells that have migrated for 6 h in a Matrigel matrix. Histograms indicate the proportion of cells exhibiting particular morphologies. For each cell pool, 80–100 cells were classified in three independent experiments. *, **, and *** indicate p < 0.01, p < 0.001, and p < 0.0001, respectively. Scale bar is 10 μm.

