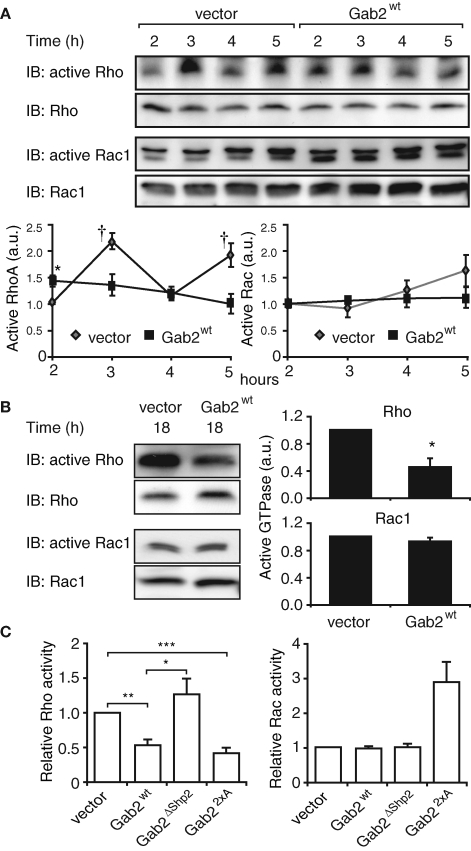
FIGURE 6:
Activation of Rho family GTPases in Gab2-overexpressing cells. Effect of Gab2 on activation of RhoA and Rac1 (A) during cell spreading or (B) in spread cells (18 h). Cell lysates were used in pull-down assays for activation of specific GTPases. Levels of GTP-bound RhoA or Rac1 were normalized for their corresponding expression levels. Graphs indicate activation relative to that in control cells at 2 h. Values are mean ± SE of four independent experiments. † and * indicate p < 0.05 and p < 0.01, respectively, by unpaired Student’s t test. (C) Effect of Gab2 mutants on RhoA and Rac activity. Cells expressing Gab2 or the indicated mutants were allowed to spread on collagen IV for 18 h, and then activation of RhoA and Rac was assayed as in (A). Numbers indicate activation relative to vector controls, which are arbitrarily set at 1.0. Data are derived from n ≥ 3 experiments (RhoA) and n = 2 experiments (Rac). *, **, and *** indicate p < 0.01, p < 0.001, and p < 0.0001, respectively. a.u.: arbitrary units.

