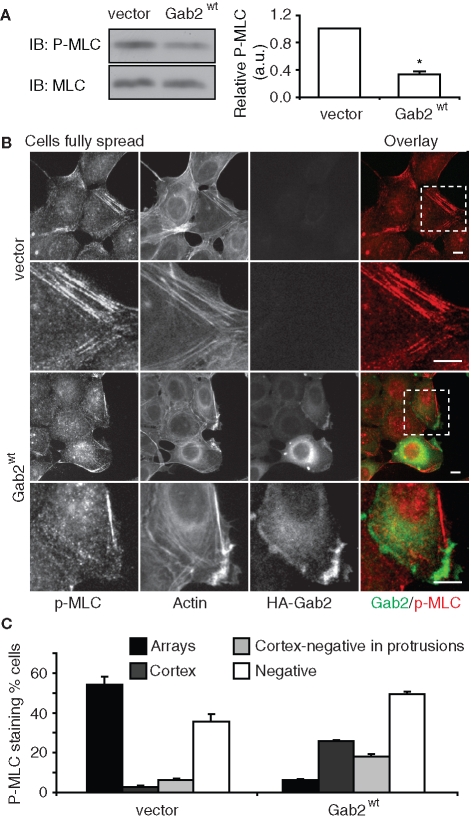
FIGURE 8:
Gab2 overexpression perturbs regulation of MLC. (A) MLC2 phosphorylation. Cells were allowed to spread for 18 h on collagen IV. Cell lysates were Western blotted as indicated. Phosphorylation of MLC2 was normalized for total protein expression and is expressed relative to the value for vector cells, which was arbitrarily set at 1.0. Data represent the mean ± SE of three independent experiments. * indicates p < 0.01 by unpaired Student’s t test. (B) Localization of pMLC. Cells treated as in (A) were stained as indicated. Enlarged views of the insets highlighted are shown in the lower panels for each cell type. Scale bar is 10 μm. (C) Quantification of pMLC staining patterns. The graph indicates the percentage of cells with pMLC in arrays (arrays), cortical pMLC (cortex), cortical pMLC but also pMLC-negative protrusions (cortex-negative in protrusions), and lacking pMLC staining (negative).

