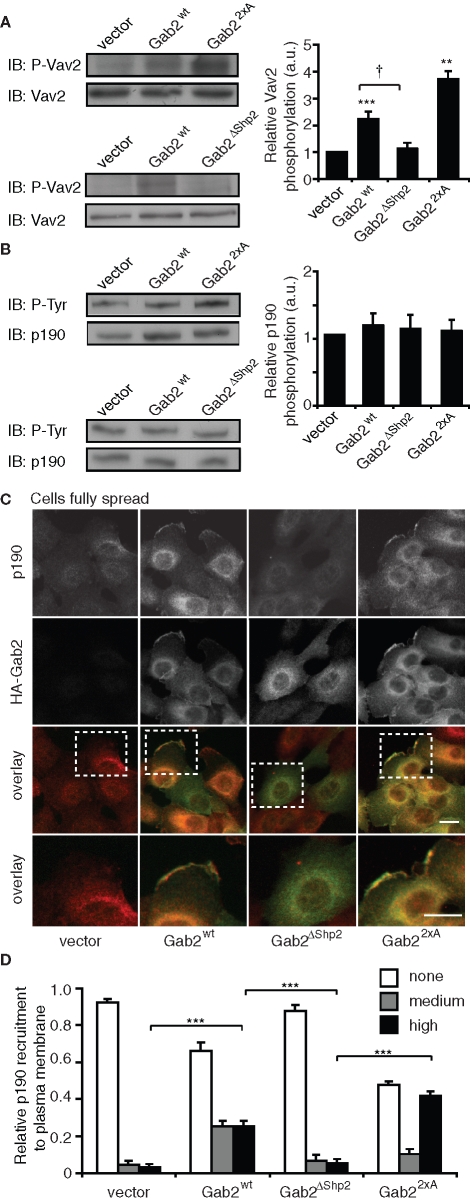
FIGURE 9:
Effects of Gab2 overexpression on regulation of Vav2 and p190A RhoGAP. (A) Tyrosine phosphorylation of Vav2. Cells were allowed to spread for 18 h on collagen IV. Cell lysates were then Western blotted for pVav2 or total Vav2. The graph indicates relative tyrosine phosphorylation of Vav2 in cells overexpressing Gab2 or the indicated mutants. Western blots were subjected to densitometry and tyrosine-phosphorylated Vav2 normalized for Vav2 levels. Data were then expressed relative to the value for vector controls, which was arbitrarily set at 1.0. †, **, and *** indicate p < 0.05, p ≤ 0.001, and p < 0.0001, respectively, for statistical significance relative to vector controls. (B) Tyrosine phosphorylation of p190A RhoGAP. Cells were treated as in (A). Cell lysates were subject to immunoprecipitation with an anti-p190A RhoGAP antibody, and immunoprecipitates were Western blotted with the indicated antibodies. The graph indicates relative tyrosine phosphorylation of p190A RhoGAP. Blots were subjected to densitometry and tyrosine-phosphorylated p190A RhoGAP normalized for total levels of protein. Data were then expressed relative to the value for vector controls, which was arbitrarily set at 1.0. (C) Gab2 promotes plasma membrane recruitment of p190A RhoGAP. Cells were plated on collagen IV for 18 h and then stained for HA (Gab2) and p190. The bottom panels provide an enlarged view of the highlighted insets. Scale bars are 10 μm. (D) Relative p190A RhoGAP membrane recruitment in the different cell pools. A total of 100–150 cells for each group were counted in three independent experiments. Data represent mean ± SE. *** indicates p < 0.0001.

