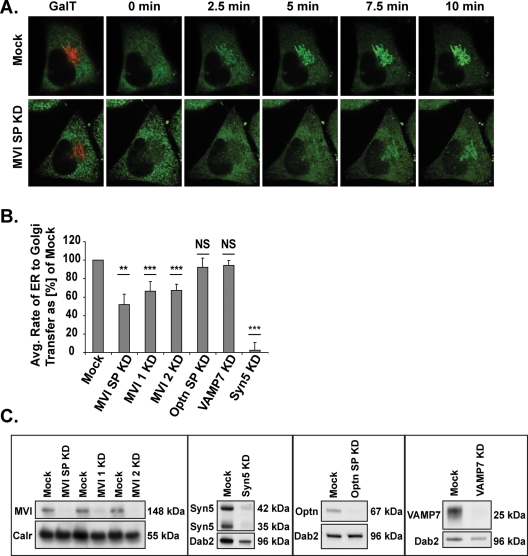
FIGURE 1:
Rate of reporter molecule transport from the ER to the Golgi complex. (A) Time-lapse images illustrating the accumulation of reporter molecule fluorescence in the Golgi region (as labeled with GalT-RFP) over the first 10 min after AP21998 addition to a mock cell (top row) or to a myosin VI knockdown cell (bottom row). (B) Rate of ER-to-Golgi reporter molecule transfer in sets of two to eight knockdown cells as a percentage of mock. Knockdown of myosin VI with SMARTpool primers (SP), individual primer 1, or individual primer 2 results in 48, 34, or 33% decreases in ER-to-Golgi transport rate, respectively (unpaired t test; n = 5, 4, 5 experimental sets; p = 0.005, p = 3 × 10⁻⁸, p = 3 × 10⁻¹⁰). Knockdown of optineurin or VAMP7 has no significant effect on the rate of ER to Golgi transport (unpaired t test; n = 4, 6 experimental sets; p = 0.3, p = 0.6), while a knockdown of syntaxin5 results in a 97% decrease in this rate (unpaired t test; n = 6 experimental sets; p = 8 × 10⁻⁸). Error bars represent standard error of the mean (SEM). *p ≤ 0.05, **p ≤ 0.01, ***p ≤ 0.001. (C) Western blot analysis of siRNA knockdown of optineurin, myosin VI, VAMP7, and syntaxin5.

