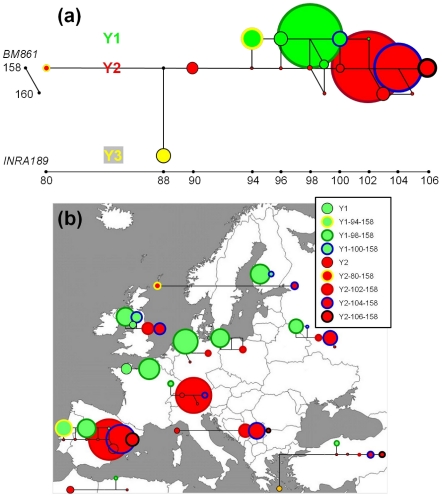
Figure 2. Median-joining networks of Y-chromosome haplotypes using SNPs and two microsatellite markers.
The size of each circle represents the number of chromosomes present in each haplotype. (a) Haplotype relationships for the complete dataset. (b) Regional networks defined for 11 geographic breed groups (India excluded). Haplotypes are indicated with the colouring scheme shown in (b).

