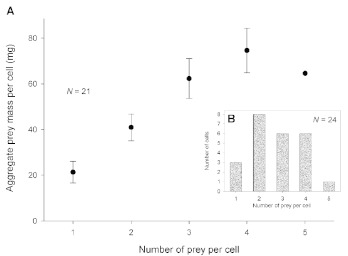
Figure 2.
(A) Relationship between number of prey per cell and aggregate prey mass (wet weight) per cell (mean ± SEM) in 21 completed cells. Overall, the aggregate prey mass increased linearly with the number of prey per cell. (B) Frequency distribution of number of prey per cell in 24 completed cells. High quality figures are available online.

