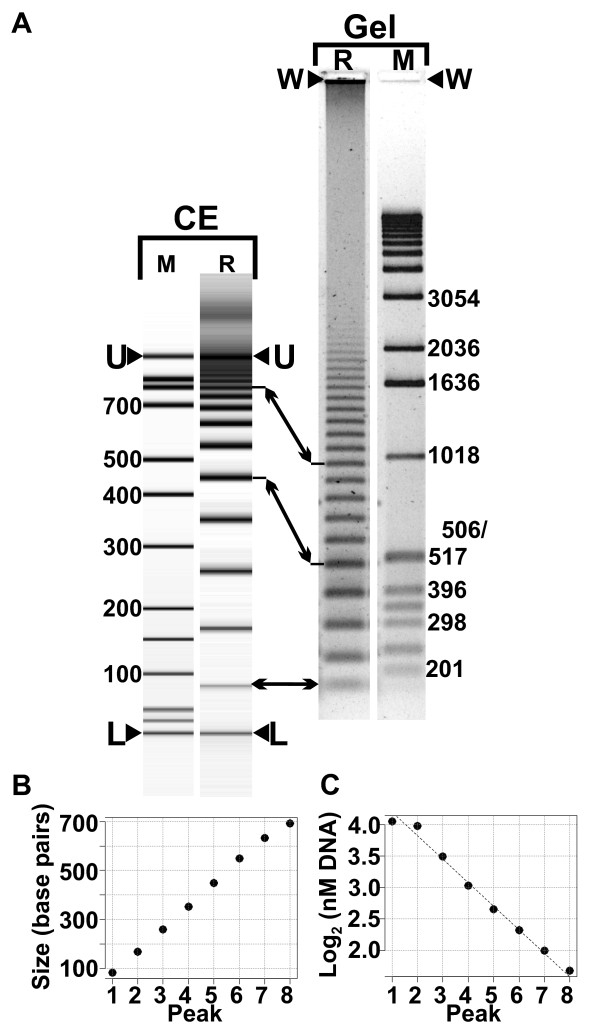
Figure 1.
RAM reaction products. A) Visualization of RAM reaction products by capillary electrophoresis (CE) and by agarose gel electrophoresis (Gel). CE lane M: CE ladder; CE lane "R", RAM reaction products. Arrowheads labelled U and L indicate CE upper and lower markers. Gel lane R: RAM reaction products (same reaction as CE lane R). Gel lane M, DNA size markers. Arrowheads labelled "W" mark the gels' loading well. Arrows between CE lane R and Gel lane R mark corresponding RAM product bands. B) A plot of DNA band-size vs. band number. C) A plot of log2 (molecule number as nM concentration) vs. band number.

