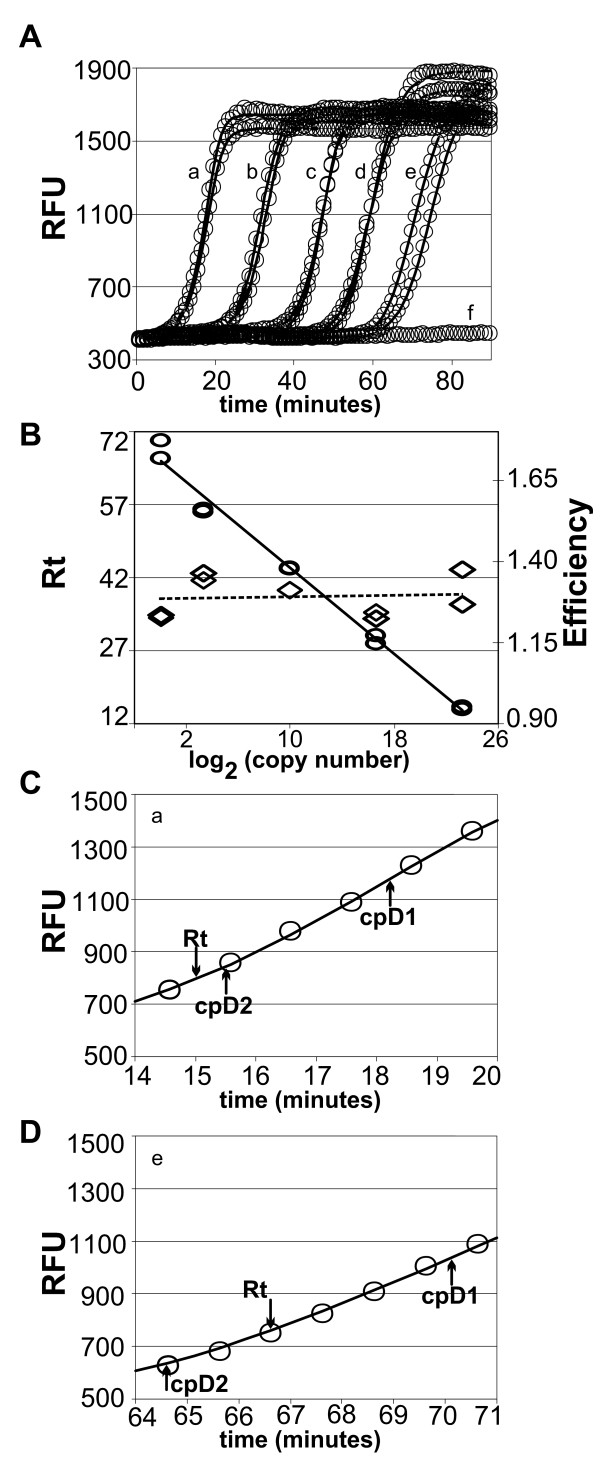
Figure 4.
Real-time analysis of RAM reactions. Replicate RAM reactions were initiated with the indicated number of template molecules and fluorescent signals were collected over 15-second intervals per minute. Continuous lines through circles were generated using a model fitted to the data for each reaction. Letter-labels in Figures 4A, C, and D indicate dilution (x) followed by relative template copy number (parenthesized): a, 1 × (107 copies), b, 100 × (105 copies); c, 104× (1000 copies), d, 106 × (10 copies), e, 107 × (1 copy); and f, no-template control. RFU, relative fluorescence units; Rt, response time. Figure 4A. RAM reaction discrete data points are shown as graphic circles; solid lines were generated by fitted models. Inset letters mark the template level for each pair of curves, except for no-template control signals where the data for one of four essentially identical reactions is shown. Figure 4B. Response times are plotted as ovals vs. log2 of the initial copy number. The solid line is a least-squares fit to the log-linear data. Diamonds indicate the reaction's efficiency; a broken line indicates a least-squares fit to the efficiency values. Figure 4C. Detail of data-points and model-curve for one of reactions "a" in Figure 4A. cpD1, maximum of first derivative; cpD2, maximum of second derivative. cpD1 marks where signal gain per unit time declines and can be taken as an upper bound of maximum efficiency amplification. Figure 4D. Detail (as for Figure 4C) of data-points and model-curve for one of reactions "e" in Figure 4A.

