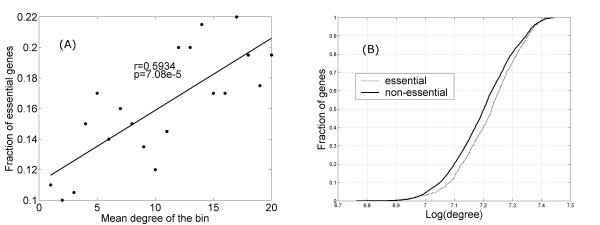
Figure 11.
Genes of higher network degree are more likely to be essential genes. (A). Fraction of essential genes goes up linearly with increasing network degree (r = 0.59, p ~ 7e-5). (B) Cumulative distribution fraction (CDF) plot shows that the network degree distribution of essential genes is skewed toward having higher network degrees (p < 1e-5, KS test).

