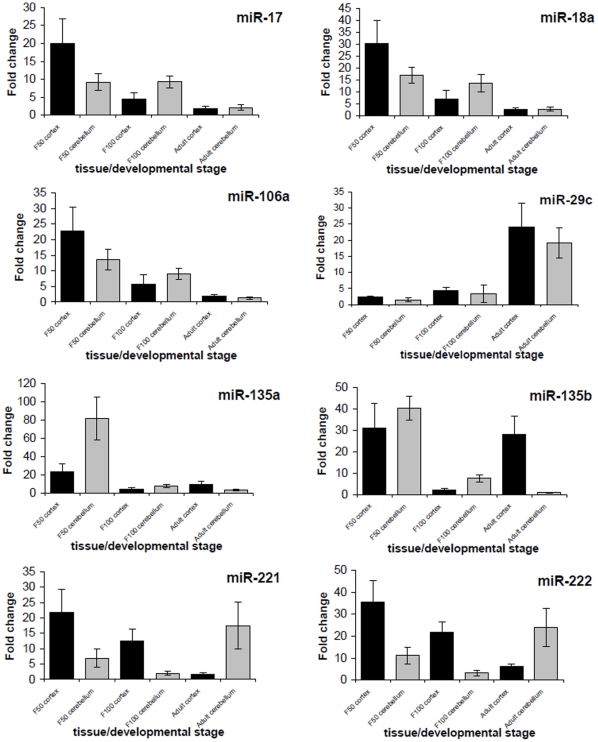
Figure 4. Quantitative PCR expression profiles of selected microRNAs.
MicroRNA specific qPCR expression profiles. Expression rates between various samples are presented by fold changes in relation to the lowest, normalized expressed value. The error bars of qPCR represent a standard deviation of the mean of 16 replicates.

