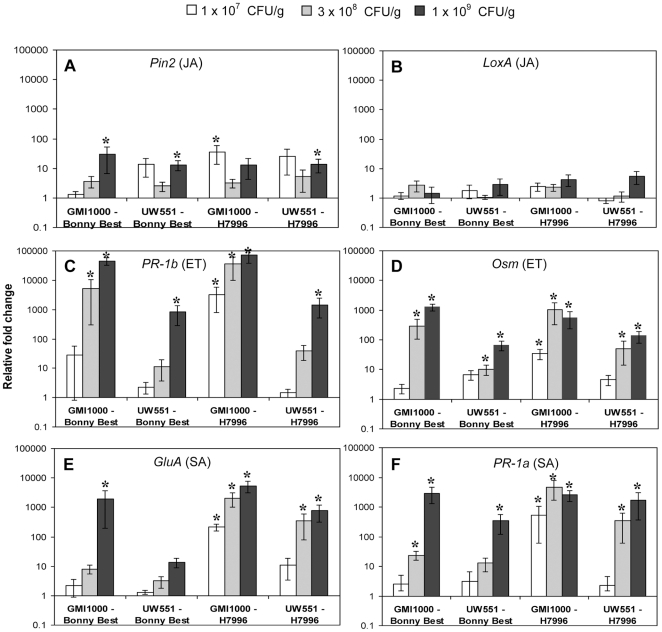
Figure 2. Expression of tomato defense genes following soil-soak inoculation with Ralstonia solanacearum strains GMI1000 or UW551 in susceptible cultivar Bonny Best or horizontally resistant line H7996.
Genes represent activation of the jasmonic acid (JA) pathway (A: Pin2, B: LoxA), the ethylene (ET) pathway (C: PR-1b, D: Osm), and the salicylic acid (SA) pathway (E: GluA, F: PR-1a). Gene expression was measured by qRT-PCR in response to three pathogen cell densities: 1×10⁷ CFU/g stem (symptomless plants, white bars), 3×10⁸ CFU/g (symptomless or first wilting signs, grey bars), and 1×10⁹ CFU/g (early disease corresponding to DI = 1, black bars). Asterisks above bars indicate significant differences (P>0.05) in gene expression between mock and R. solanacearum inoculated tomatoes. P-values reflecting differences between cell densities (CFU), tomato cultivars and strains are shown in Table S2. Bars show normalized mean fold induction relative to mock-inoculated control plants (± SE). N = 6 to 12 plants for each cell density and strain, >3 independent experiments.

