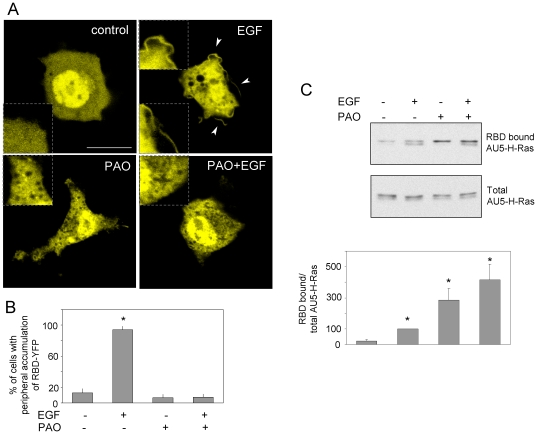
Figure 6. Effect of PAO on Ras activation.
(A) COS-7 cells were transfected with YFP-RBD, serum starved for 16 h and pre-incubated with vehicle or 1 µM PAO for 1 h before stimulation with 100 nM EGF. Cells were visualized live by confocal fluorescence microscopy. Shown are representative images from at least five experiments with similar results. Dotted inserts show enlarged areas from the same cells for better visualization. Arrowheads mark the accumulation of YFP-RBD at defined locations of the cell periphery. Bar, 20 µm. At least 40 cells were monitored per experimental condition and the percentage of cells showing accumulations of YFP-RBD at the cell periphery is shown in (B) as average values ± standard error of mean (SEM) of five independent experiments. (C) Cells were treated as above and cell lysates were subjected to pull-down on GST-RBD beads for collection of Ras in its active conformation. Levels of RBD-bound and total AU5-H-Ras were assessed by western blot. Results shown are representative of three assays. The lower panel presents the quantitation of RBD-bound AU5-H-Ras/total AU5-H-Ras ratios from three independent experiments as average values ± SEM. *p<0.05 vs vehicle.

