
Figure 3.
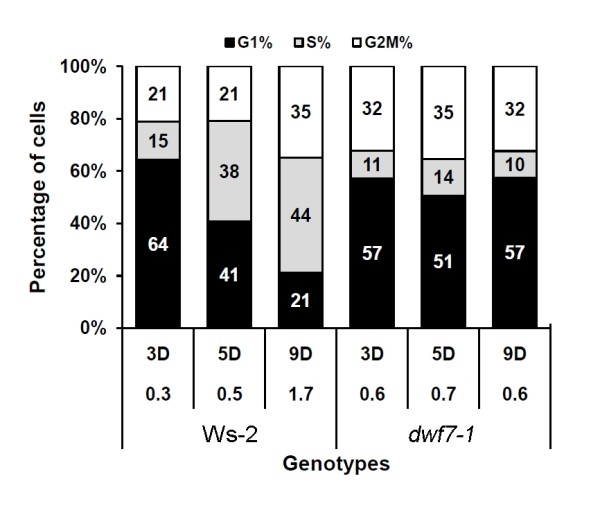
Flow cytometry-based time-course analysis of the DNA profile in the nuclei derived from different genotypes of calli. Nuclei isolated from calli grown for 3, 5, and 9 days after transferring to fresh media were subjected to flow cytometry. Percentage of DNA profile corresponding to G1, S, and G2/M phases are plotted in the stacked column chart. Numbers in the stacked column are percentage of each phase. The numbers below each column indicate G2/M vs. G1 ratios. Shown are triplicate experiments of at least 5,000 nuclei.