
Figure 5.
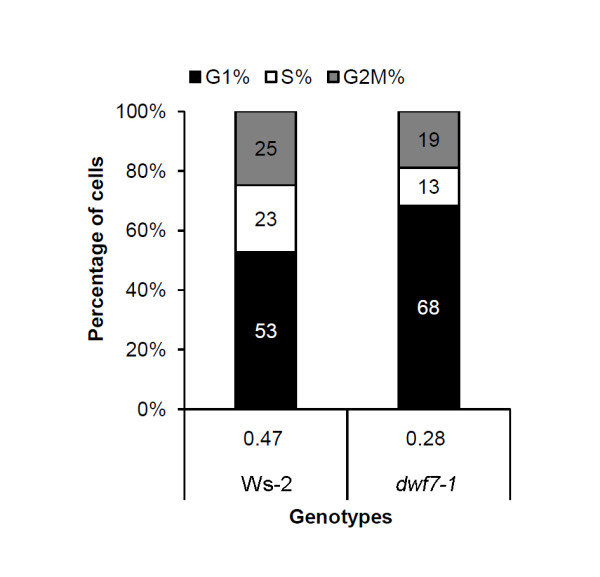
DNA profile in the root cells of dwf7-1 and its parental wild type. Flow cytometry-based DNA profiles in the nuclei derived from roots of different genotypes were determined. Percentage of DNA profile corresponding to G1, S, and G2/M phases are plotted in the stacked column chart. Numbers in the stacked column are percentage of cells in each phase. The numbers below each column indicate ratios of G2/M vs. G1. Shown are triplicates of at least 3,000 nuclei.