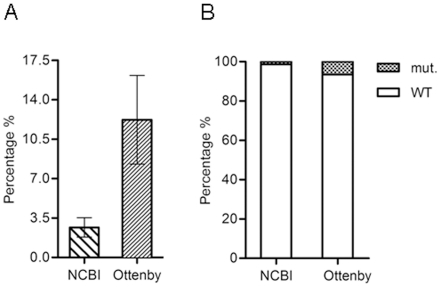
Figure 1. Comparison of mutant proportions from the NCBI and Ottenby databases carrying zanamivir and OC resistance mutations.
A) The mean percentages of six replicates from the NCBI and five replicates from the Ottenby data set. All percentages represent subtypes containing mutant virus isolates. Subtypes without mutants are not represented in this analysis. The NCBI mean ± SEM percentage of mutants was 2.66±0.865; N = 6. The Ottenby mean ± SEM percentage of mutants was 12.22±3.931; N = 5. p<0.05, unpaired t-test. B) Frequencies of wild-type isolates in the NCBI and Ottenby data sets were 716 (98.76%) and 215 (93.48%) isolates, respectively. Frequencies of mutant isolates in the NCBI and Ottenby data sets were 9 (1.24%) and 15 (6.52%), respectively. In the NCBI data set, only viruses isolated from mallard were counted. Bars represent the percentage of wild-types and mutants in each data set. p<0.0001, chi-squared test.

