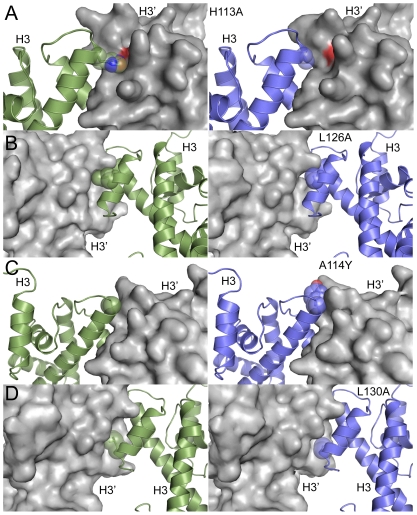
Figure 1. Inter-histone H3-H3′ interface is destabilized by mutagenesis.
Models for H3-H3′ interface mutations that were tested in this study (right panels) are shown in comparison to the wild type interface (left panels). One of the binding partners is shown in surface representation, while the other is shown in cartoon representation with spheres depicting the mutated residues. H113A (A) results in the loss of a hydrogen bond with D123 across the interface, L126A (B), results in loss of hydrophobic interactions across the interface, A114Y (C) introduces bulky side-chain in the interface, and L130A (D) also results in loss of hydrophobic contacts across the interface. The structures were rendered using PyMOL (http://www.pymol.org).

