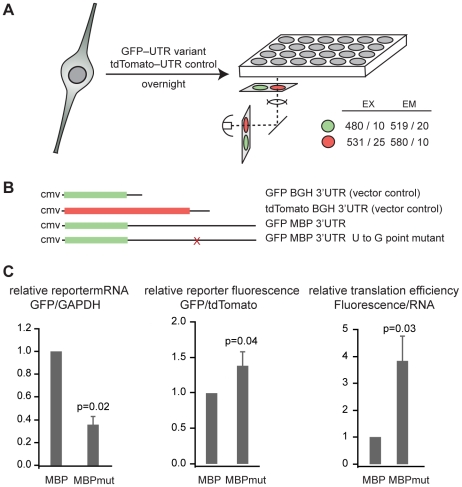
Figure 1. The QSBE is a regulatory element in the Mbp 3′ UTR.
(A) Schematic drawing of the fluorescence reporter assay. (B) Constructs used in reporter assays. The Mbp 3′ UTR or the Mbp 3′ UTR with the U to G point mutation were inserted into the 3′ UTR of phrGFPII-1. tdTomato was unmodified and served as a transfection control. (C) tdTomato and GFP mRNA level were measured by real time RT-PCR from cells co-transfected with the indicated GFP construct and the tdTomato transfection control. The data in the graph are the average and standard deviation of six replicates from two independent experiments. The ratio of green to red fluorescence intensity was determined from nine replicates in three independent experiments. The graph represents the average and standard deviation. The normalized reporter fluorescence was divided by the normalized reporter mRNA to obtain a measure of translational efficiency. Error bars represent the error propagated from the standard deviation of the reporter fluorescence and real time RT-PCR data.

