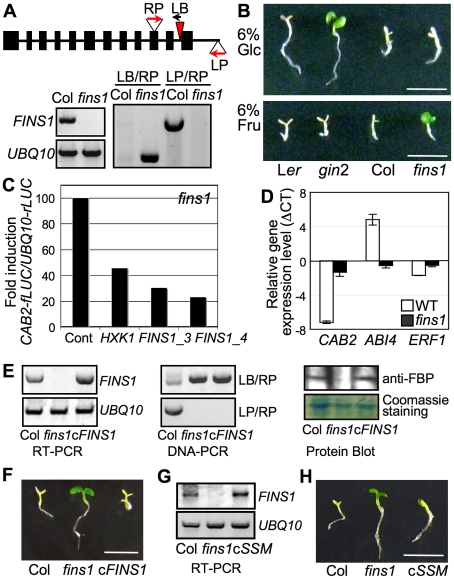
Figure 3. FINS1/FBP in fructose signaling.
(A) Molecular analysis of fins1. T-DNA insertion sites and primer (LP, RP, and LB) locations are indicated. Expression of FINS1 was shown by reverse transcription-PCR with a gene-specific primer set (Table S1). UBQ10 served as an internal control. (B) The fins1 and gin2 mutants showed different sensitivities to 6% glucose (Glc) and fructose (Fru). The seedlings were grown for 5 d under a 16 h photoperiod. Scale bar, 5 mm. (C) FINS1 and HXK1 expression suppressed CAB2-fLUC activity. Protoplasts isolated from fins1 seedlings were cotransfected with CAB2-fLUC and HXK1, FINS1/FBP_3, or FINS1/FBP_4. UBQ10-rLUC was used as a transfection control. An empty vector served as a treatment control. (D) Marker gene expression was compromised in fins1. The gene expression was measured using 5-d-old seedlings grown on MS agar media containing 6% fructose or mannitol. (E) Expression analysis of FINS1 transcripts (RT-PCR and DNA-PCR) and proteins (protein blot) in a selected FINS1-complemented fins1 (cFINS1). (F) cFINS1 seedlings were fructose sensitive similar to WT (7 d). Scale bar, 5mm. (G) Expression analysis of catalytically inactive FINS1_ssm in a selected FINS1_ssm-complemented fins1 (cSSM) seedling. (H) cSSM seedlings were fructose sensitive similar to WT (7d).

