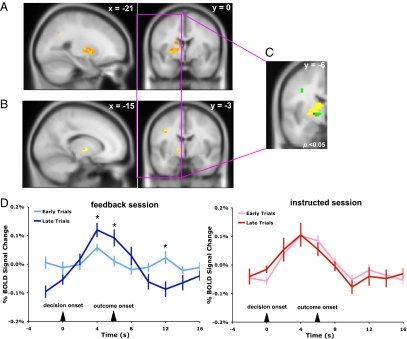
Fig. 3.
BOLD responses for prediction errors in both sessions. (A) Activity of the striatum showed significant correlation to the PE signal in the feedback session (P < 0.05, corrected). Such correlations were not observed in the above structures in the instructed session (P < 0.01, uncorrected). (B) A two-way ANOVA showed an interaction between session (feedback and instructed) and learning phase (early and late) in the left striatum. (C) Striatal activation identified in the PE (A, yellow) and session × learning phase interaction (B, green) analyses, and the overlapping region (red). (D) BOLD response patterns in the overlapping region for the early and late phases of learning in the feedback and instructed sessions (*, time points with significantly different BOLD responses between early and late learning phases, P < 0.05; ± SEM).

