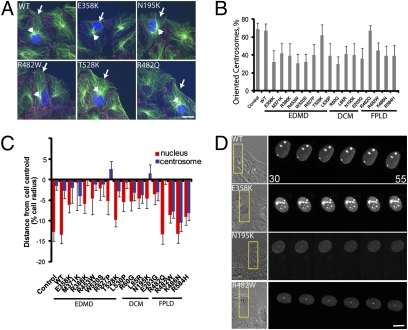
Fig. 1.
Disease-causing variants of lamin A block centrosome orientation. (A) LPA-stimulated NIH 3T3 fibroblasts expressing FLAG-tagged lamin A variants and stained for FLAG tag (blue), pericentrin for centrosomes and β-catenin for cell edges (red), and microtubules (green). Arrows denote expressing cells, and arrowheads denote the centrosome. (Scale bar, 10 μm.) (B) Centrosome orientation in NIH 3T3 fibroblasts expressing lamin A variants. Centrosomes were considered oriented when they were in a pie-shaped section facing the wound edge; random orientation is 33% by this measure (21). Error bars are SEM for >45 cells from three independent experiments, and centrosome orientation was significantly different from that of WT control (P < 0.001) for all lamin A variants except T528K and R482Q. (C) Nuclear (red) and centrosome (blue) positions along the axis perpendicular to the wound for cells expressing lamin A variants. The cell centroid is zero; positive values are located toward the leading edge, and negative values are located toward the cell rear. Values are expressed as a percentage of the cell radius to account for variations in cell size (20, 40). Error bars are SEM for >30 total cells from at least three independent experiments for each variant. The nuclear position in all EDMD and DCM variants (except T528K) was significantly different from that of WT (P < 0.001), and the centrosome position in all FPLD variants (except R482Q) was significantly different from that of WT (P < 0.001). (D) Montages from movies of NIH 3T3 fibroblasts expressing red fluorescent protein-tagged versions of the indicated lamin A variants. The leftmost panel shows a phase image. The box (Left) indicates the region shown at higher magnification in the fluorescence images (Right). Images were acquired every 5 min (time is in minutes after addition of LPA). (Scale bar, 5 μm.)

