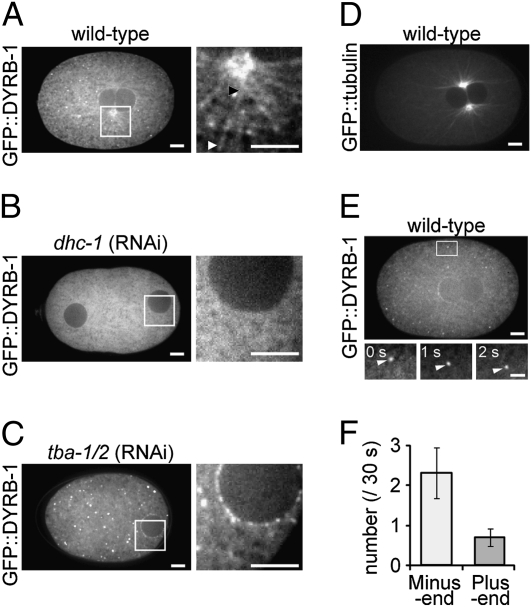
Fig. 2.
Cytoplasmic localization of GFP::DYRB-1 during centrosome centration. Confocal fluorescence images of C. elegans embryos expressing GFP::DYRB-1 are shown (A–C). The boxed region in each panel is also shown magnified (Right). The arrowheads (black and white) in A indicate both ends of a filamentous signal of GFP::DYRB-1: (B) dhc-1 (RNAi) and (C) tba-1/2 (RNAi). (D) The pattern of astral microtubules revealed using a GFP::tubulin strain. (E) Tracking of DYRB-1 puncta. A fraction of DYRB-1 shows a punctate signal, a portion of which moves directionally as shown in the lower magnified images (bar, 2 μm). (F) The direction and frequency of fast (≥0.5 μm/s) and continuous (≥2 s) movements of DYRB-1 puncta within 30 s after pronuclear meeting (n = 10). The average number ± SEM is shown. (Scale bars, 5 μm except in E, Lower.)

