Fig. 3.
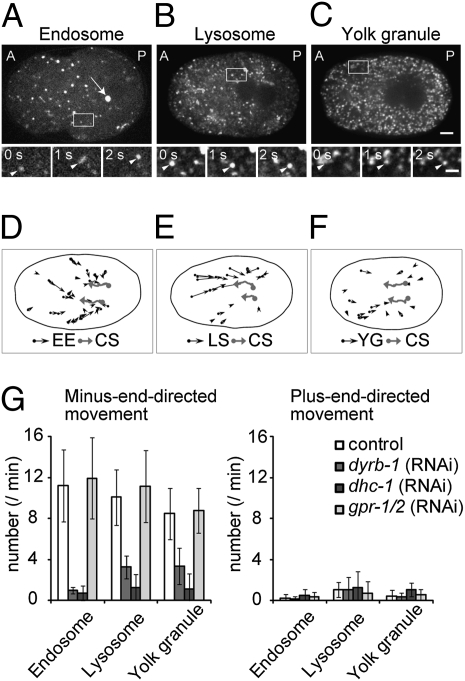
Movements of intracellular organelles during centrosome centration. Confocal fluorescence images of (A) an embryo expressing both GFP::TBG-1 (arrow) and GFP::EEA-1(FYVE*2), (B) an embryo in which the lysosomes were stained with LysoTracker, and (C) an embryo expressing the yolk granule marker GFP::VIT-2. A, anterior; P, posterior. (Scale bar, 5 μm.) Three sequential fluorescence images of the boxed regions in A–C are magnified (bar, 2 μm) below each panel. The arrowhead marks a moving organelle. (D–F) A typical example of the movements of early endosomes (EE), lysosomes (LS), or yolk granules (YG; ≥0.5 μm/s, black arrows) for 2 min after pronuclear meeting is illustrated. Black ellipse represents the outline of the egg; gray arrows mark the movement of centrosomes (CS). (G) The number of each organelle that moved continuously for at least 2 s at a rate of at least 0.5 μm/s toward the minus end or plus end of the microtubules was counted for 2 min after pronuclear meeting in control, dyrb-1 (RNAi), dhc-1 (RNAi), and gpr-1/2 (RNAi) embryos (n ≥ 5). The average number ± SD of each organelle per 1 min is shown.

