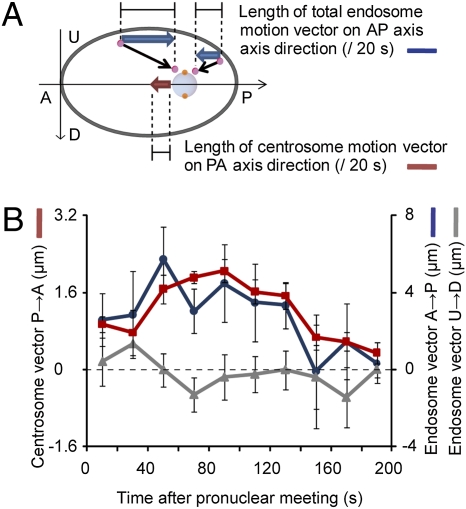
Fig. 5.
The correlation between early endosome movement and centrosome centration. (A) Schematic of the measurement of the movement of early endosomes [GFP::EEA-1(FYVE*2), blue arrows] and centrosomes (GFP::TBG-1, red arrow) along the AP axis. The net movements of early endosomes in the anterior (A)-to-posterior (P) direction were calculated by subtracting the sum of P-to-A movements from the sum of A-to-P movements. Likewise, the net movements of early endosomes in the perpendicular direction to the AP axis [upside (U) – downside (D)] were calculated. (Gray ellipse, embryo; light blue circle, pronucleus; pink circle, early endosome; black arrow, movement of early endosome.) The length of movement of total early endosomes and the centrosomes was measured during a 200-s period just after pronuclear meeting. (B) The average length of movement of total early endosomes (blue line, AP axis component; gray line, perpendicular component) and centrosomes (red line, AP axis component) during each 20-s period on the equatorial plane is plotted (n = 9). Left y axis, the length of the centrosome movements (μm); right y axis, the length of total early endosome movements (μm); x axis, time of the measurement from after pronuclear meeting. Error bars represent SEM.

