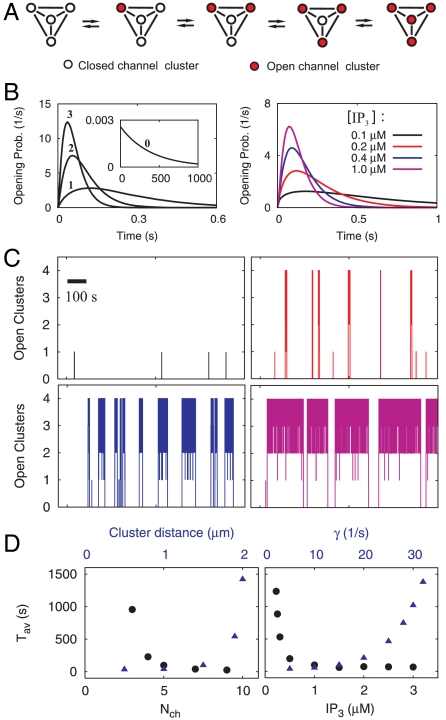
Fig. 2.
Various patterns of Ca2+ signals can be inferred from properties of single clusters. (A) Configurations of open clusters (red) in the tetrahedral geometry. (B) Left: Waiting time distribution for the opening of a cluster in the rest state (0) and with No = 1, 2, or 3 clusters open. The probability to open early increases with No (number at lines). Because No determines [Ca2+], this corresponds to CICR. Right: Probability to open the second cluster at [IP3] as indicated. It is very unlikely that the second cluster opens before the first one closes with small [IP3]. (C) Stochastic simulations reveal different types of Ca2+ signals at various [IP3]: only puffs (Upper Left), spiking (Upper Right), bursting (Lower Left), and overstimulation (Lower Right). The colors indicate [IP3] as in B, p = 3.85 s-1. (D) The average ISI Tav depends on many different parameters. Here, we show (Left) its dependence on the number of channels per cluster Nch (black dots) and the cluster distance a (blue triangles), and (Right) its dependence on [IP3] (black dots) and the channel closing rate γ (blue triangles). Parameter values not mentioned in this legend are given in Table 1.

