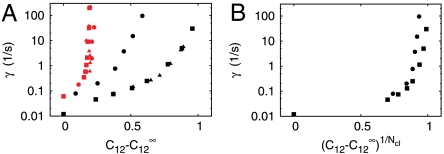
Fig. 3.
Conditions for spiking. (A) Spiking occurs for values of the coupling  and the channel closing rate γ between the red and black symbols. They show the long-Tav criterion for spiking Cl (red) and the short-Tav criterion Cs (black), respectively (see Conditions for Spiking and Bursting). Coupling values smaller than Cl entail essentially only local puffs, and coupling values larger than Cs cause the regime of overstimulation. The spike range increases with γ. We investigated both the four-cluster model (squares) and the eight-cluster model (circles). Cl values are similar for both models, whereas Cs values depend on the number of clusters Ncl. The spike range becomes smaller for a larger number of clusters involved in spike nucleation. Each pair of squares and circles indicates the critical (
 ) at the standard parameters (Table 1), whereas coupling was changed by varying cluster distance (values range from 0.5 μm to ∞). The triangles show the critical values for the four-cluster model obtained when we varied
  by changing [IP3]. That leads to very similar results. (B) The Nclth root of the short-Tav criterion Cs is shown. It suggests that Cs depends essentially exponentially on Ncl, because the Nclth root of Cs is similar for the four-cluster model (squares) and the eight-cluster model (circles).

