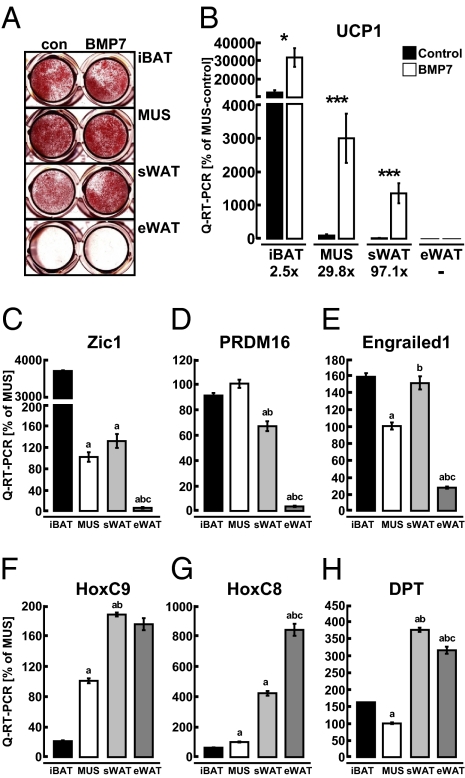
Fig. 1.
ScaPCs from muscle and sWAT, but not from eWAT, can be induced to undergo brown adipogenesis. Distinct expression profiles are associated with brown adipogenic capacity. (A) Oil Red O staining of lipid-accumulating cells in both control and BMP7 pretreated cells from iBAT, MUS, sWAT, and eWAT. (B) Quantitative RT-PCR of UCP1 in differentiated ScaPCs with and without BMP7 pretreatment. Fold-changes are given for each tissue type of BMP7-treatment over control. Black bars indicate control conditions; white bars indicate BMP7-pretreatment. Data are presented as mean ± SEM (n = 3). Asterisks denote significant differences between control and BMP7-pretreated cells. *P < 0.05; **P < 0.01; ***P < 0.001. (C–H) Quantitative RT-PCR analysis of undifferentiated Sca-1+ progenitor cells isolated from iBAT, MUS, sWAT, and eWAT: (C) Zic-1, (D) PRDM16, (E) Engrailed1 (Eng1), (F) HoxC9, (G) HoxC8, and (H) dermatopontin (DPT). Data are presented as mean ± SEM (n = 3); “a” depicts statistically significant differences (P < 0.05) between iBAT and the indicated tissue; “b” depicts statistically significant (P < 0.05) differences between MUS and indicated tissue; “c” depicts statistically significant (P < 0.05) differences between sWAT and eWAT.

