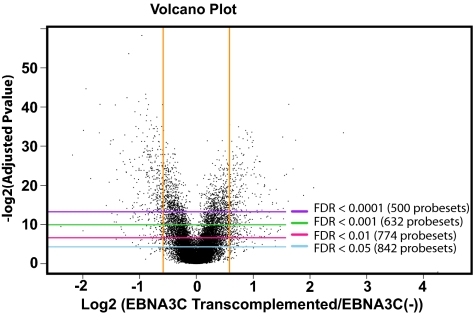
Fig. 1.
Volcano plot of EBNA3C effects on cell RNA levels. Quadruplicate RNAs prepared from each of three EBNA3CHT LCLs grown under nonpermissive or permissive conditions (12 samples, each) for 7 d were compared with triplicate total RNAs from each of three EBNA3CHT LCLs grown under nonpermissive conditions and transcompletmented with EBNA3C for 12 wk (9 samples). RNAs were profiled using U133 Plus 2.0 arrays. Each probe set was represented by a dot placed in 2D space determined on the y axis by log2 P value after adjustment for multiple testing hypotheses and on the x axis by log2 (fold change in RNA levels comparing nonpermissive EBNA3CHT LCL RNA with RNA from the same LCLs transcomplemented with wild-type EBNA3C). P values were adjusted using Benjamini–Hochberg correction. Horizontal lines indicate FDRs of 0.05, 0.01, 0.001, 0.0001, from bottom to top. The vertical lines indicate 1.5-fold change in EBNA3C up- or down-effect.

