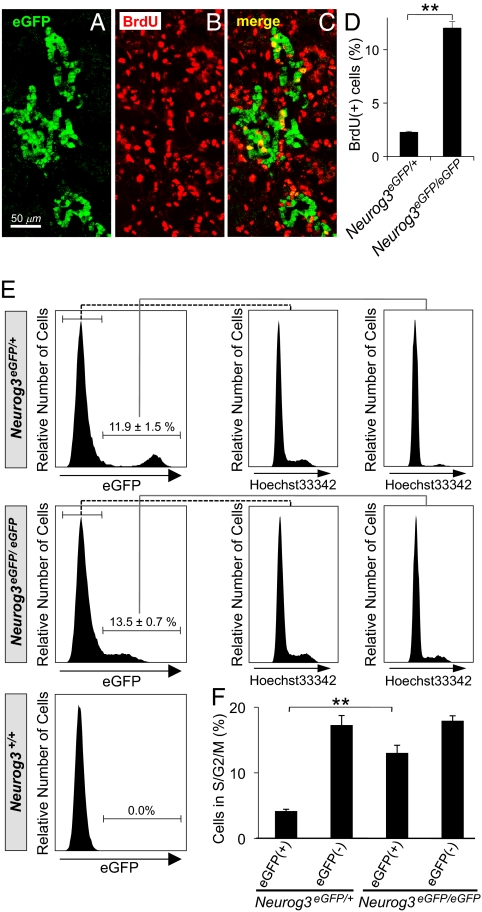
Fig. 2.
Proliferation of endocrine lineage cells in Neurog3-deficient embryos. (A–C) After 3 h of BrdU labeling at E15.5, the pancreas was dissected from Neurog3eGFP/eGFP embryos, and immunofluorescence costaining was performed for eGFP (green; A and C) and BrdU (red; B and C). Costaining cells, which appear yellow in the merged panel (C), were quantified, expressed as percentage of total eGFP+ cells, and compared with Neurog3eGFP/+ pancreases in the bar graph in D. In E, pancreatic cells were dissociated from Neurog3eGFP/+, Neurog3eGFP/eGFP, and Neurog3+/+ littermates at E14.5, stained with the DNA dye Hoechst 33342, and analyzed by flow cytometry. The percentage of eGFP+ cells proliferating in S/G2/M phases for each genotype is shown in F. Each data point represents the mean ± SEM of at least three independent experiments. **P < 0.01, Neurog3eGFP/eGFP vs. Neurog3eGFP/+, by two-tailed Student's t test.

