Fig. 4.
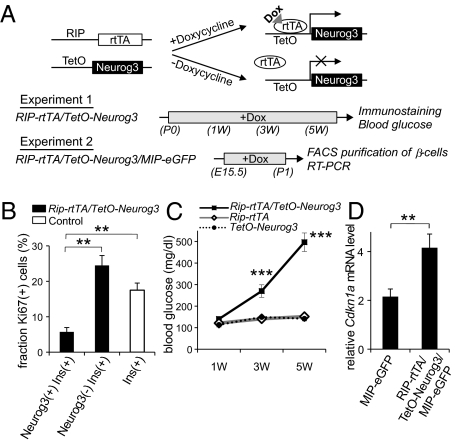
Ectopic expression of Neurog3 in mature β-cells. As outlined in A, transgenic mice were generated with the tetracycline-regulated promoter driving Neurog3 expression (TetO-Neurog3 mice) and crossed with mice expressing the reverse-tetracycline receptor under the control of the rat insulin 2 promoter (RIP-rTtA mice; ref. 35) to generate Rip-rtTA/TetO-Neurog3 double transgenic mice, and these mice were crossed with mice expressing eGFP under the control of the mouse insulin 1 promoter (MIP-eGFP mice; ref. 35) to generate Rip-rtTA/TetO-Neurog3/MIP-GFP triple transgenic mice. In experiment 1, Rip-rtTA/TetO-Neurog3 double transgenic mice and controls (Rip-rtTA and TetO-Neurog3) received doxycycline from postnatal day 0 to 6 wk. The pancreases of some animals were harvested after 1 wk and stained for insulin, Neurog3, and the proliferation marker Ki67 (B). For the remaining animals, random blood glucose levels were checked every two weeks (C), and the pancreases were harvested at 6 wk for immunohistochemistry (Fig. S4). In experiment 2, Rip-rtTA/TetO-Neurog3/MIP-eGFP triple transgenic mice and MIP-eGFP controls (Rip-rtTA/MIP-eGFP and TetO-Neurog3/MIP-eGFP) received doxycycline from E15 for 5 d, and then on postnatal day 0, pancreases were harvested and sorted by FACS, and the levels of Cdkn1 AMRNA were analyzed by real-time RT-PCR (D). Each data point represents the mean ± SEM of at least three independent experiments. **P < 0.01, Neurog3+/Insulin+ vs. Neurog3-/Insulin+ cells (B), and MIP-eGFP controls vs. Rip-rtTA/TetO-Neurog3/MIP-eGFP mice (D), by two-tailed Student's t test. ***P < 0.001 Rip-rtTA/TetO-Neurog3 vs. control littermates by an analysis of variance (ANOVA).

