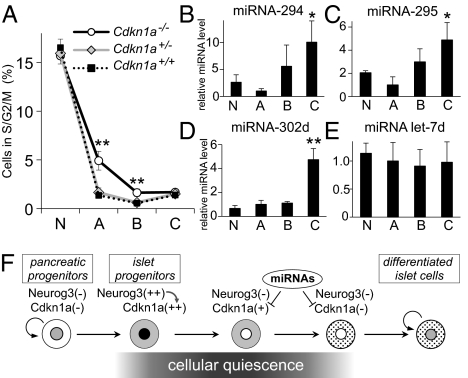
Fig. 5.
Function and regulation of Cdkn1a in the pancreas. Pancreatic cells from Neurog3-Timer embryos with the genotypes shown were dissociated at E15.5, stained with the DNA dye Hoechst 33342, and analyzed by flow cytometry. The percentage of cells proliferating in S/G2/M phases is shown in A for each of the four gates from Fig. 1C. Data are presented as the mean ± SEM of at least five independent experiments. **P < 0.01, Cdkn1a−/− knockout vs. Cdkn1a+/− heterozygous or Cdkn1a+/+ wild-type embryos, by an analysis of variance (ANOVA). In B–E, dissociated cells from pancreases from Neurog3-Timer embryos at E17.5 were sorted by FACS into the four gates shown in Fig. 1C. Expression levels of miRNA-294 (B), miRNA-295 (C), and miRNA-302d (D), and control miRNA Let7d were determined by TaqMan miRNA assay, normalized to snoRNA-202, and shown relative to the level in gate A. Each data point represents the mean ± SEM of at least three independent experiments. *P < 0.05, **P < 0.01 vs. gate A, by two-tailed Student's t test. F shows a proposed model for cell cycle regulation in the pancreatic endocrine lineage.

