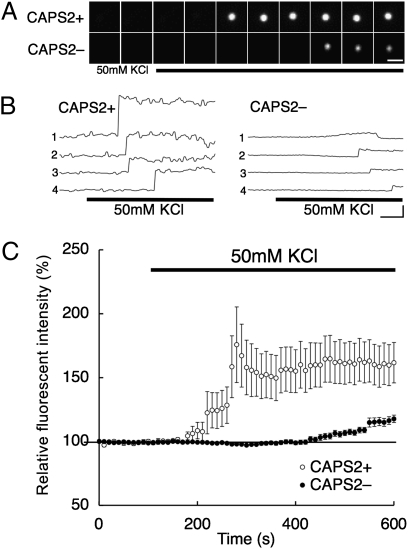
Fig. 2.
Dynamics of BDNF-pHluorin secretion events. (A) Representative time-lapse images of depolarization-induced single BDNF-pHluorin exocytosis events in axons of CAPS2-KO hippocampal neurons cotransfected with (CAPS2+, Upper Row) and without (CAPS2−, Lower Row) CAPS2-tdTomato. Images shown were taken every min from 2 min before to 8 min after the onset of 50-mM KCl stimulation at 0 min (third panel from the left). (Scale bar, 1 μm.) (B) Sample traces of BDNF-pHluorin fluorescence dynamics induced during 50-mM KCl stimulation (indicated by bar at bottom). (Scale bars: horizontal bar, 100 s; vertical bar, 100 AU) (C) Average traces of BDNF-pHluorin fluorescence dynamics in the presence and absence of CAPS2-tdTomato. Thick bar indicates 50-mM KCl stimulation. Average traces were normalized to maximum punctum fluorescence intensity before depolarization. Between 160 and 480 s after 50-mM KCl administration, CAPS2+ neurons (n = 28 from three different cultures) exhibited an average intensity of 169.5 ± 18.3%, whereas CAPS2- neurons (n = 36 from four different cultures) exhibited an average intensity of 105.2 ± 2.4% (P < 0.01, Student's t test). Error bars indicate SEM.

