Fig. 3.
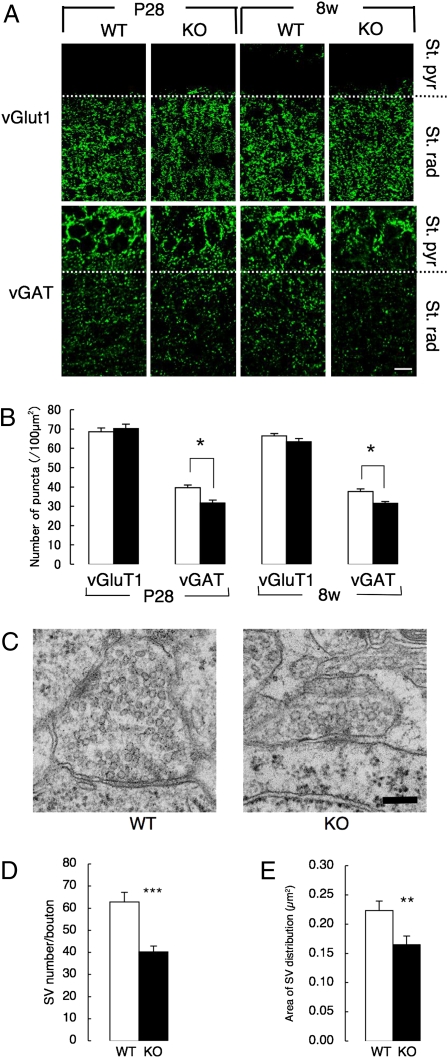
Morphological abnormalities of GABAergic interneurons in the CAPS2-KO mouse hippocampus. (A) Representative immunofluorescence images of vGluT1 and vGAT in the hippocampal CA1 region of WT and CAPS2-KO mice at P28 and 8 wk. St. pyr, stratum pyramidale; St. rad, stratum radiatum. (Scale bar, 10 μm.) (B) Number of vGluT1+ and vGAT+ puncta in the stratum radiatum. Error bars represent SEM. *P < 0.05, using Student's t test (n = 12, 16, 14, and 14 regions in P28 WT and CAPS2-KO mice and in 8-wk-old WT and CAPS2-KO mice, respectively, from at least six slices from three mice in each category). (C) Representative ultrastructure of GABAergic terminals. (Scale bar, 250 nm.) (D and E) Number of SVs per GABAergic terminal (D) and area of SV distribution (E). Error bars represent SEM. **P < 0.01, and ***P < 0.001 using Student's t test (n = 26 synapses in 8-wk-old WT mice and 29 synapses in 8-wk-old CAPS2-KO mice, from six pictures from three mice in each genotype).

