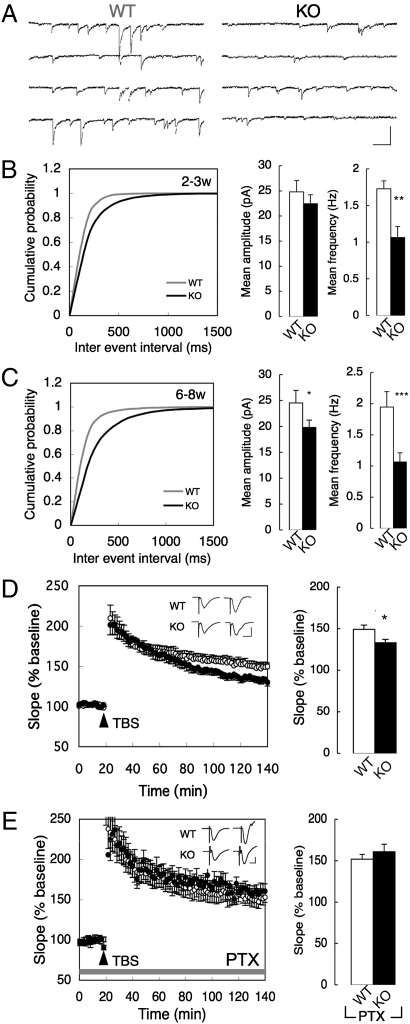
Fig. 4.
Functional impairments of GABAergic interneurons in the CAPS2-KO mouse hippocampus. (A) Examples of mIPSCs in 8-wk-old WT and CAPS2-KO mice. (Scale bars: horizontal, 100 ms; vertical, 100 pA.) (B and C) Cumulative plot of mIPSC frequency (Left), mean amplitude (Center), and frequency (Right) in 2- to 3-wk-old (B) and 6- to 8-wk-old (C) WT and CAPS2-KO mice. P < 0.05 using the Kolmogorov–Smirnov test for cumulative plot. *P < 0.05, **P < 0.01, and ***P < 0.001 using Student's t test for mean amplitude and frequency. Error bars represent SEM. (n = 9 from four 2- to 3-wk-old WT mice, 12 from five 2- to 3-wk-old CAPS2-KO mice, 9 from four 6- to 8-wk-old WT mice, and 9 from five 6- to 8-wk-old CAPS2-KO mice). (D) (Left) Time course of TBS-induced LTP at CA3-CA1 synapses. (Inset) Representative traces immediately before (Left) and 120 min after (Right) TBS for each genotype. (Scale bars: horizontal bar, 10 ms; vertical bar, 1 mV.) (Right) Results 120 min after TBS (n = 10 each for five WT mice and seven CAPS2-KO mice). Error bars represent SEM. *P < 0.05 using Student's t test. (E) (Left) Time course of TBS-LTP in the presence of PTX. (Inset) Representative traces immediately before (Left) and 120 min after (Right) TBS for each genotype. (Scale bars: horizontal bar, 10 ms; vertical bar, 200 μV.) (Right) Results 120 min after TBS (n = 9 slices for 6- to 8-wk-old WT and CAPS2-KO mice, four or five mice for each genotype). Error bars represent SEM.

