
Figure 1.
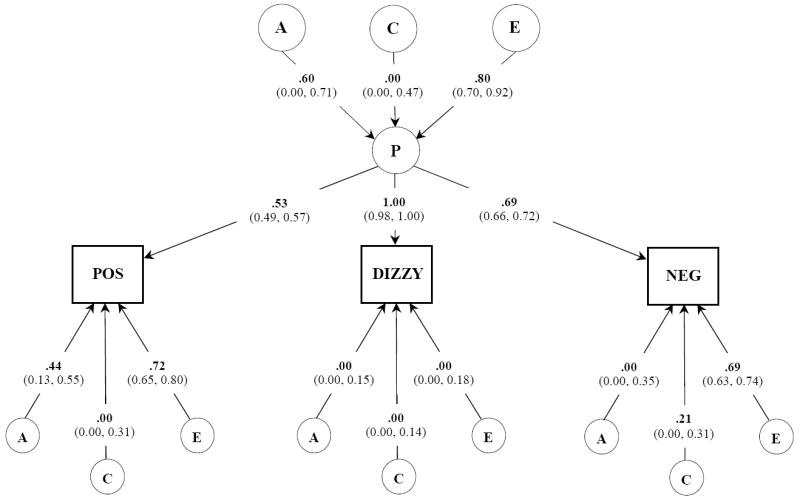
Common pathways model. Unstandardized parameter estimates (95% confidence intervals) are shown. The chi-square goodness-of-fit for the overall ACE model is: -2LL = 17712.86, d f= 7470. Circles depict latent variables while rectangles depict self-reported subjective experiences. Single headed arrows represent the partial regression of an observed variable on the latent factor. Variances for each observed variable was standardized to 1.0. A, indicates additive genetic influences; C, indicates shared environmental influences; E, indicates individual specific environmental experiences; P, common underlying pathway or phenotype; POS, positive subjective experiences; NEG, negative subjective experiences.