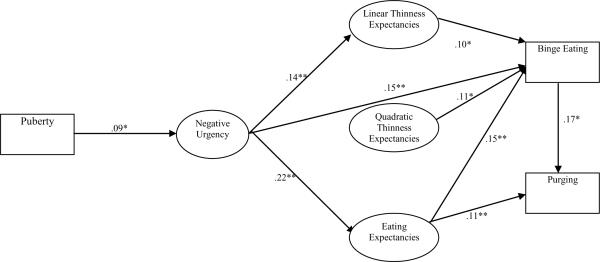
Figure 1.
Visual representation of the empirical test of the risk model. The arrows represent the significant tested pathways; the corresponding numbers refer to the maximum likelihood coefficient for each respective relationship. Variables represented in ovals are latent variables; variables represented in squares are measured variables. Relationships modeled but not visually represented are as follows: we did not include either error terms or disturbance terms, nor did we include correlations among the three expectancy measures. In the measurement model of dieting/thinness expectancies, each parcel for linear expectancies was allowed to correlate with its square, which was a parcel for quadratic expectancies. * p < .01; ** p < .001.

