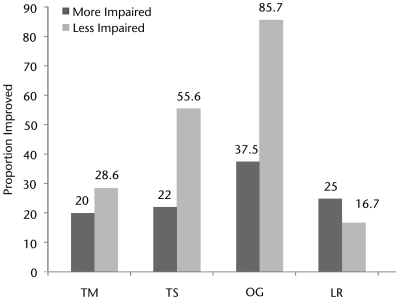
Figure 3.
Proportions of less impaired and more impaired participants in each training group achieving a minimally important difference in walking distance. Dark gray bars represent participants classified as more strength impaired. Light gray bars represent participants classified as less strength impaired. Values represent the proportion of participants in a category whose walking distance on the 2-minute walk test had improved by at least 4 m after training. LR=treadmill-based training with robotic assistance, OG=overground training with electrical stimulation, TM=treadmill-based training with manual assistance, TS=treadmill-based training with electrical stimulation.

